Identifying the Clinical Threshold of C-Reactive Protein-Triglyceride Glucose Index for Risk Stratification of Diabetes
Abstract Body: Introduction C-reactive protein-triglyceride glucose index (CTI) is a novel composite biomarker for type 2 diabetes mellitus. However, its clinical threshold for diabetes across different age and sex groups remains unclear.
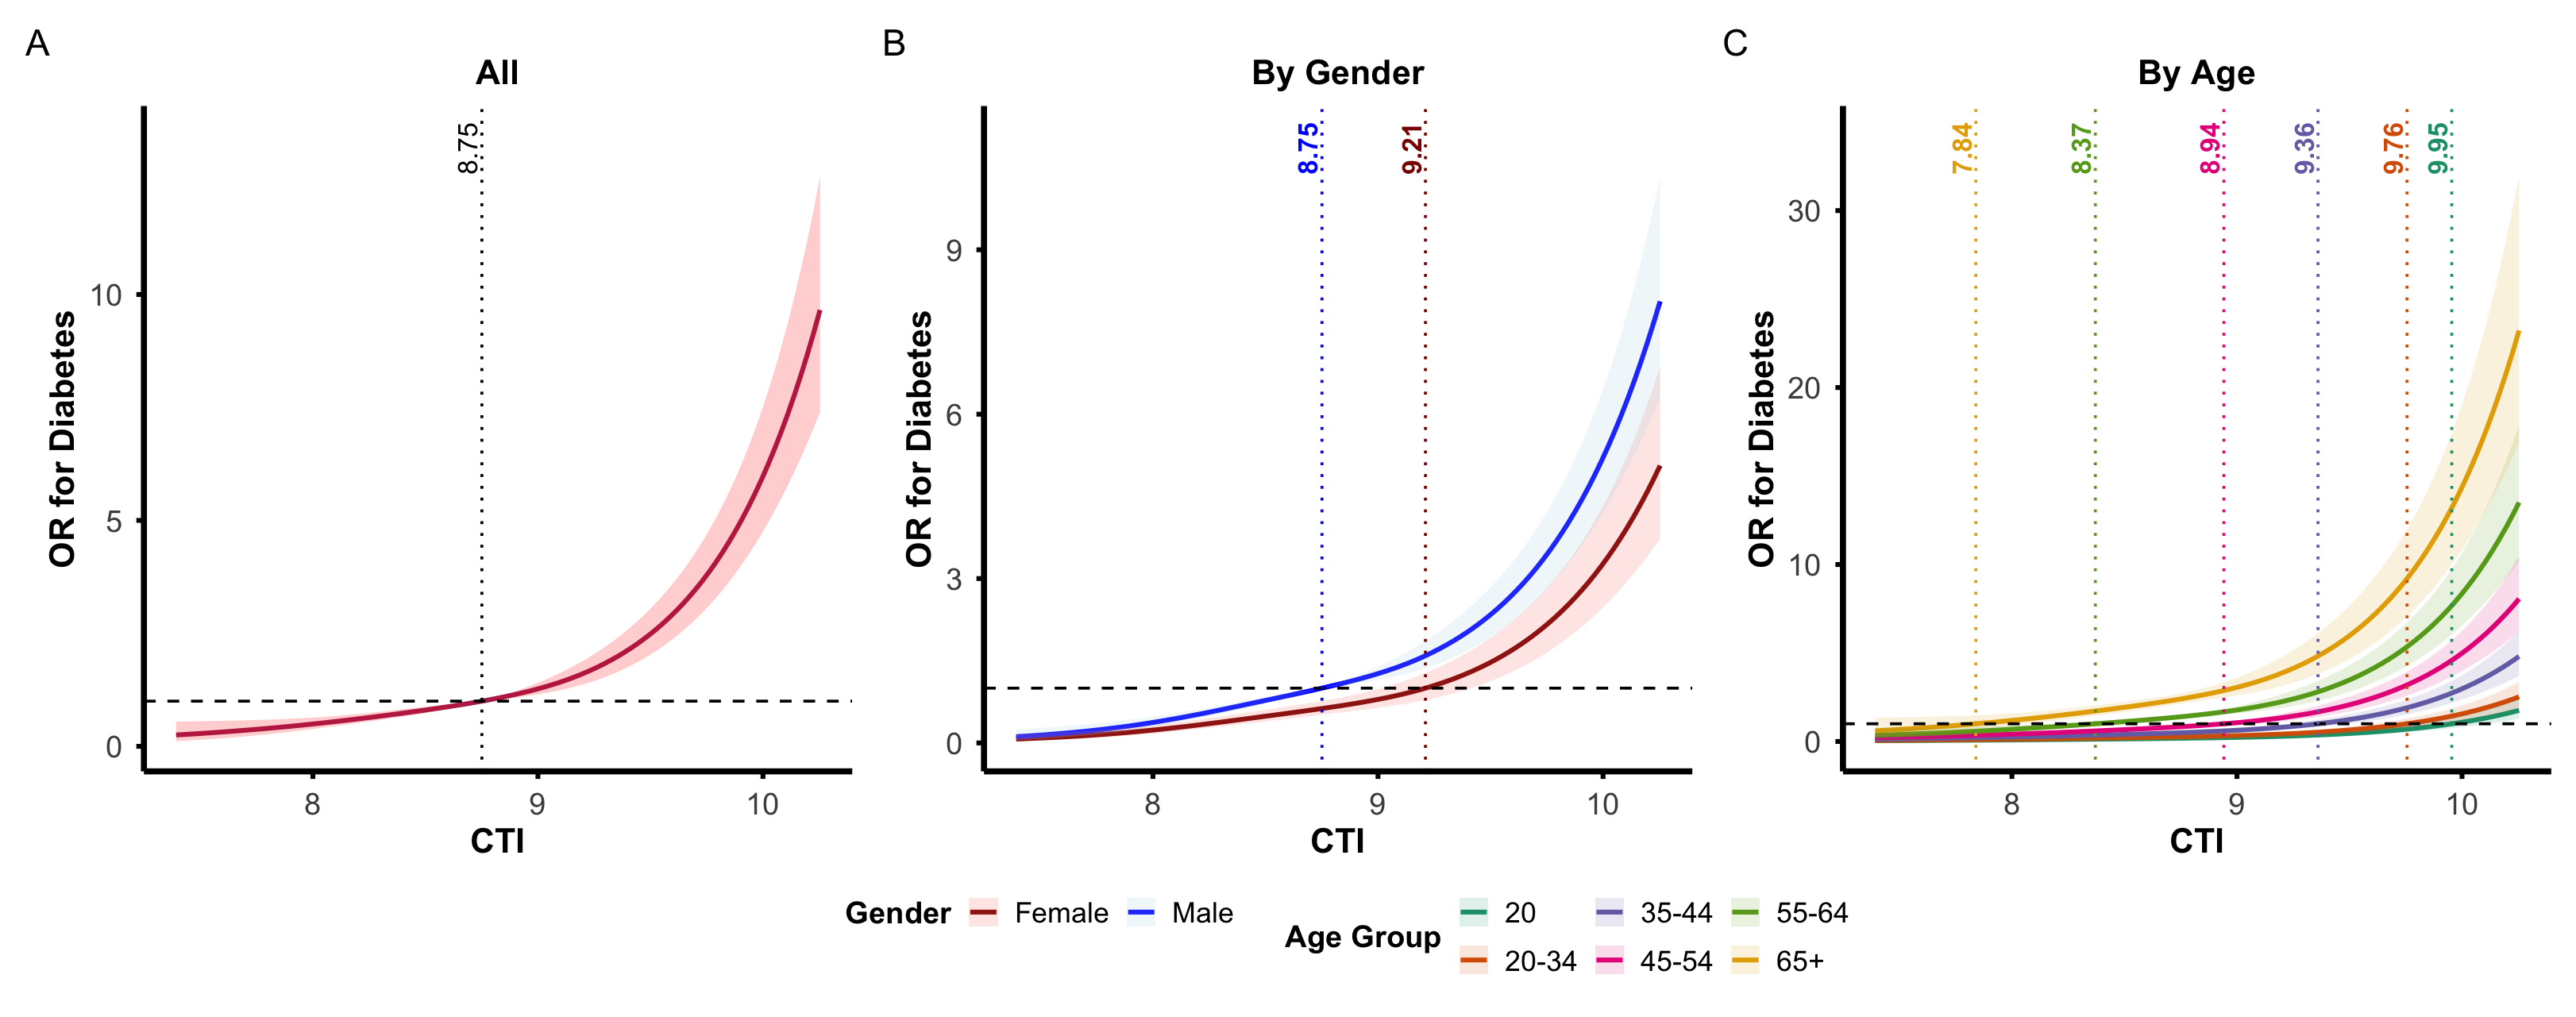
Methods Data from 3,517 National Health and Nutrition Examination Survey (NHANES) participants recruited from 2021 to 2023 with complete age, gender, triglyceride (TG), fasting blood glucose (FBG), and high-sensitivity C-reactive protein (hs-CRP) were analyzed. CTI was calculated as 0.421xLn(hs-CRP)+Ln(TG mg/dLxFBG mg/dL/2). Odds ratios (OR) with 95% CI for diabetes across five quintiles of CTI were calculated. A restricted cubic spline (RCS) of CTI with 4 knots was fit for the general population (adjusted for age and sex) and across gender and age groups. The clinical threshold was calculated by the first CTI that had an OR greater than 1. The area under the receiver operating curve (AUC) was calculated for models across all groups.
Results Across 3517 participants, 597 had diabetes. Mean CTI values are higher among diabetic participants compared to those who are not (mean CTI 9.56 vs. 8.62, P<0.001). OR for diabetes from lowest(1) to highest quintile(5) was 1.00 (ref), 1.87(95% CI 1.11–3.26), 2.56 (95% CI 1.56–4.39), 4.79 (95% CI 2.98–8.08), 17.3 (95% CI 11.0–28.8). RCS analysis in the general population and across sex and age groups revealed a dose-response relationship that differed by age group (P = 0.00019) but not by gender (P = 0.103). The CTI threshold where CTI reaches an OR > 1 was 8.75 (all), 8.75 (male), 9.21 (female), 9.95 (<20 years), 9.76 (20-34 years), 9.36 (35-44 years), 8.94 (45-54 years), 8.37 (55-64 years), and 7.84 (65+ years). The AUC for CTI was 0.845 (general population), 0.838 (males), 0.845 (females), 0.977 (<20 years), 0.935 (20-34 years), 0.868 (35-44 years), 0.816 (45-54 years), 0.746 (55-64 years), 0.721 (65+ years).
Discussion Diabetes risk is highest with increasing CTI quintiles. CTI exhibits a dose-response relationship to diabetes, with thresholds varying across age groups but not gender groups. The predictive value of CTI is highest in younger individuals, supporting its potential use for risk-stratifying individuals at an earlier stage of life.
Conclusion CTI is a novel composite biomarker in diabetes with varying clinical thresholds for different age groups. CTI with different thresholds may be used to risk-stratify participants at various age groups through further trials that validate these thresholds.
Farah, Raysha
(
Harvard Medical School
, Boston , Massachusetts , United States )
Nugrahani, Annisa
(
Harvard Medical School
, Boston , Massachusetts , United States )