Patterns of one-year change in HbA1c and Continuous Glucose Monitoring (CGM) Metrics in Older Adults with Type 2 Diabetes
Abstract Body: Background There is growing interest and use of continuous glucose monitoring (CGM) technology as an adjunct or substitute for HbA1c in assessing glycemic control. However, how changes in CGM metrics and HbA1c track together over time is poorly understood, particularly in type 2 diabetes. We investigated the patterns of change in HbA1c and CGM metrics among older adults with type 2 diabetes.
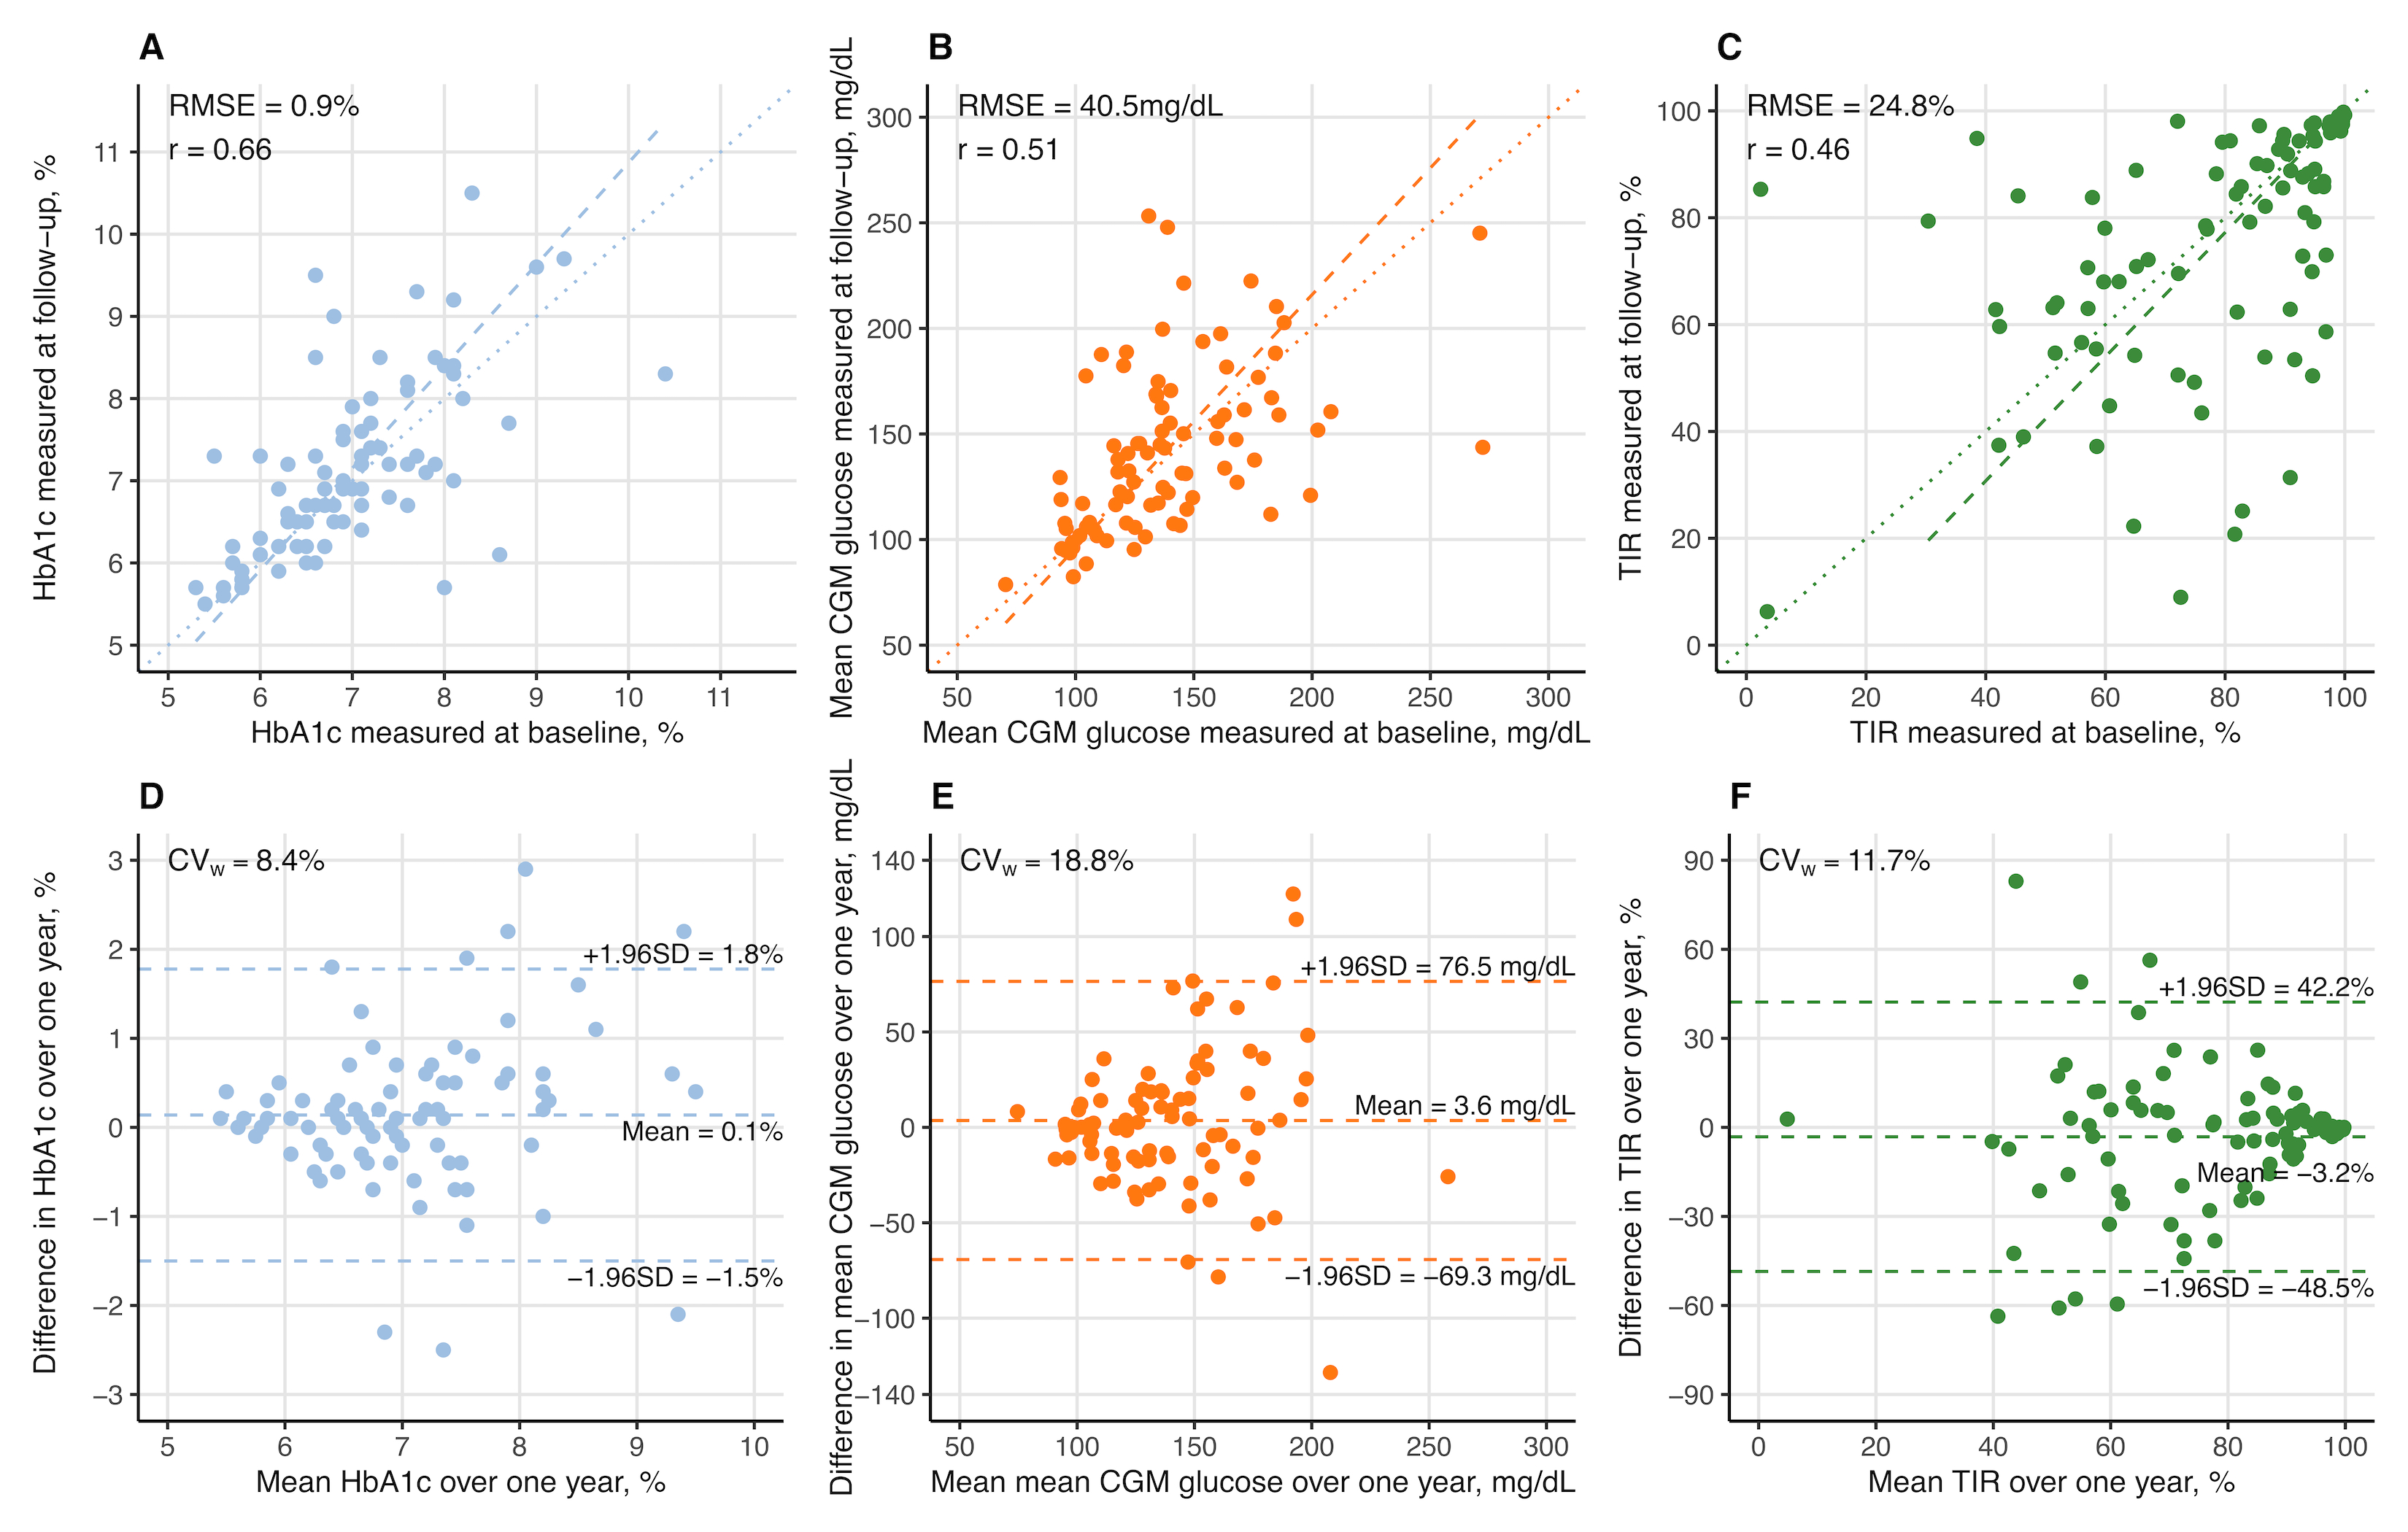
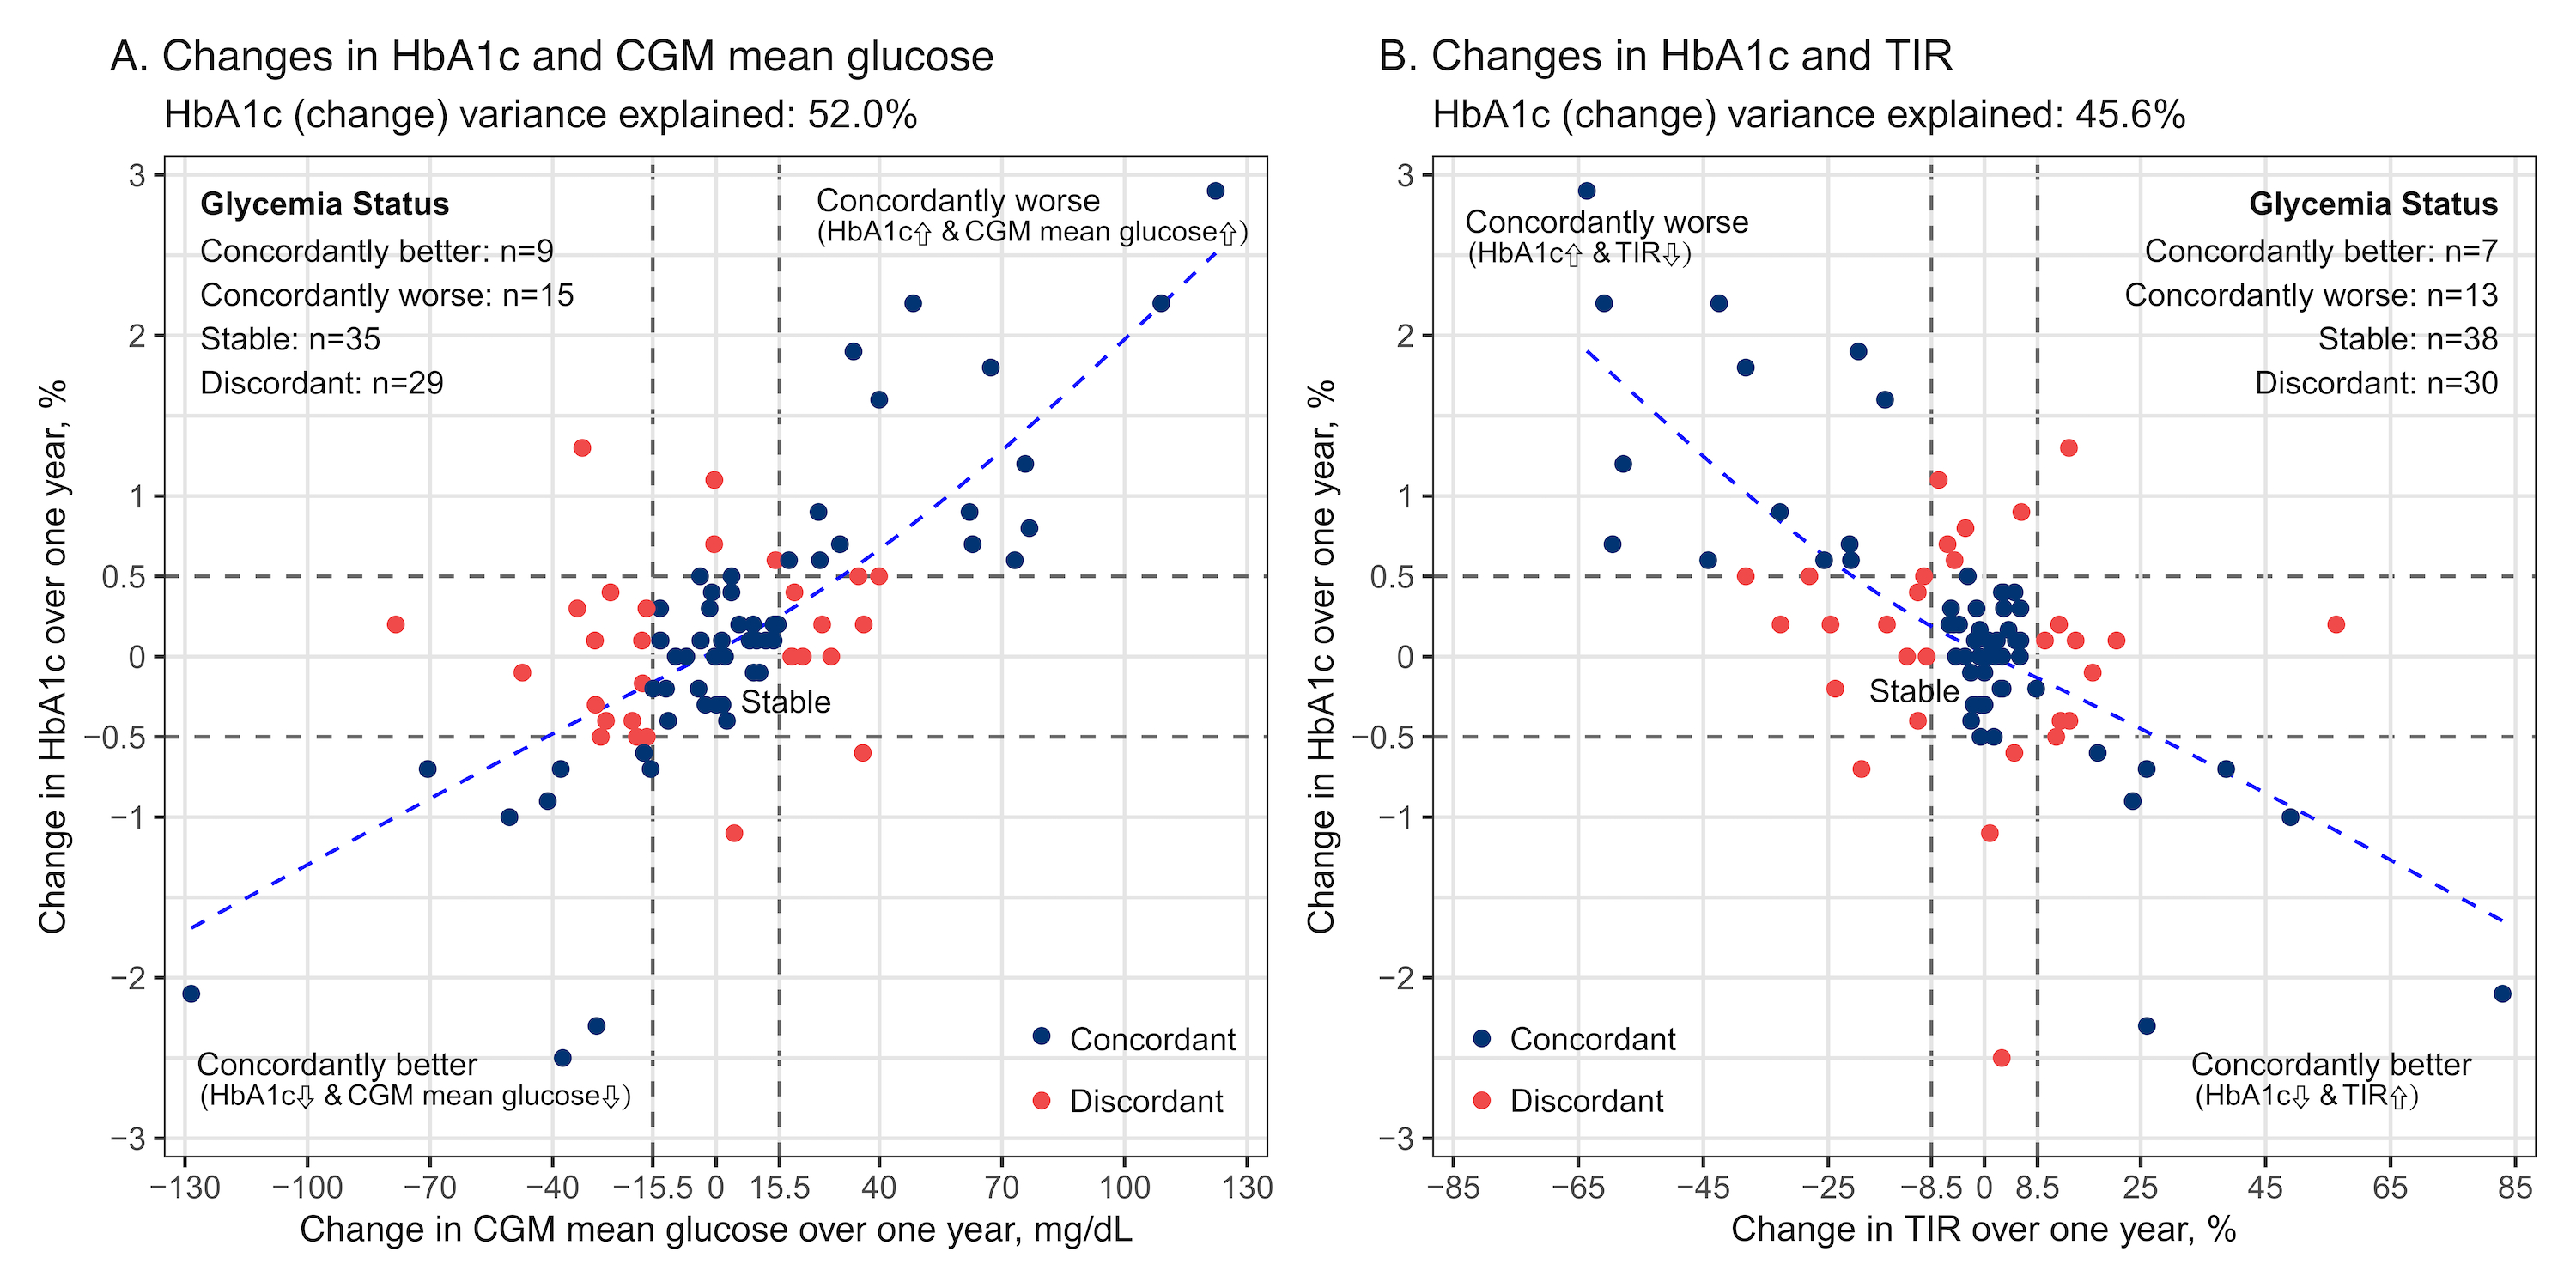
Methods We analyzed data from 88 older adults with type 2 diabetes from the Atherosclerosis Risk in Communities (ARIC) Study who had measurements of HbA1c and wore CGM sensors at visit 9 (2021-22) and visit 10 (2023). HbA1c, CGM mean glucose, and time in range (TIR, percent time with CGM glucose 70-180 mg/dL) were compared using Deming regression, Bland-Altman plots, and Pearson’s correlations. Variability was assessed using the within-person coefficient of variation (CVw). Proportion of variance in HbA1c change explained by changes in CGM metrics was estimated using linear regression with splines. Discordance was defined as having different direction or magnitude of change, based on an absolute HbA1c change of 0.5% and the corresponding changes in CGM metrics derived from linear mixed-effects models.
Results At baseline, the mean age was 82 years, 42% were women, and 27% self-identified as Black. The mean CGM wear time was 13 days (SD, 2) at both visits. Over a median of 1.6 (1.3, 1.8) years, the population mean HbA1c, CGM mean glucose, and TIR did not significantly change, with baseline means of 6.9% (SD, 0.9), 138.2 mg/dL (SD, 35.8), and 77.5% (SD, 21.4), respectively. CGM mean glucose showed higher variability (CVw=18.8%) than HbA1c (CVw=8.4%) and TIR (CVw=11.7%) (Figure 1). Changes in CGM mean glucose explained 52.0% of the variance in HbA1c change, while changes in TIR explained 45.6%. We found that approximately one-third of the participants had discordant changes between HbA1c and CGM metrics over time, with percent agreement of 67.0% between HbA1c and CGM mean glucose, and 65.9% between HbA1c and TIR (Figure 2). Similar results were found in subgroups by sex, race, diabetes medication use, and after excluding participants with reduced kidney function.
Conclusions Among older adults with type 2 diabetes, HbA1c is less variable than CGM mean glucose or TIR, and long-term changes (>1 year) in HbA1c and CGM metrics are frequently discordant. This suggests the complementary nature of using HbA1c and CGM together to monitor glucose control.
Cao, Tianyu
(
Johns Hopkins Bloomberg School of Public Health
, Baltimore , Maryland , United States )
Fang, Michael
(
Johns Hopkins Bloomberg School of Public Health
, Baltimore , Maryland , United States )
Wallace, Amelia
(
Johns Hopkins Bloomberg School of Public Health
, Baltimore , Maryland , United States )
Malek, Natalie
(
Johns Hopkins Bloomberg School of Public Health
, Baltimore , Maryland , United States )
Valint, Arielle
(
University of North Carolina Gillings School of Public Health
, Chapel Hill , North Carolina , United States )
Wang, Dan
(
Johns Hopkins Bloomberg School of Public Health
, Baltimore , Maryland , United States )
Echouffo, Justin
(
Johns Hopkins University School of Medicine
, Baltimore , Maryland , United States )
Zeger, Scott
(
Johns Hopkins Bloomberg School of Public Health
, Baltimore , Maryland , United States )
Selvin, Elizabeth
(
Johns Hopkins Bloomberg School of Public Health
, Baltimore , Maryland , United States )