Validation of Imaging-Derived Body Composition Subphenotypes Reflects Distinct Fat Distribution Patterns Associated with Different Degrees of Cardiovascular Disease Risk
Abstract Body: Obesity affects more than one billion people and drives cardiometabolic disease risk. While traditional definitions rely on BMI, recent criteria promote direct measurement of excess adiposity, such as magnetic resonance imaging (MRI).
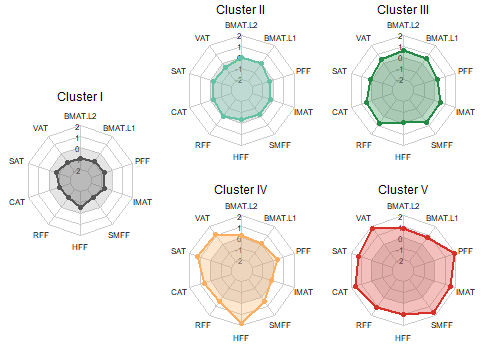
Using MRI-derived adipose tissue (AT) data of visceral, subcutaneous, bone marrow, cardiac, renal, hepatic, pancreatic, and skeletal muscle fat with k-means clustering, we previously identified five distinct body composition subphenotypes (I–V), each displaying unique cardiovascular risk profiles.
This study aimed to establish the generalizability of these subphenotypes by replication in the German National Cohort (NAKO) and validation of their association with cardiovascular disease (CVD) risk.
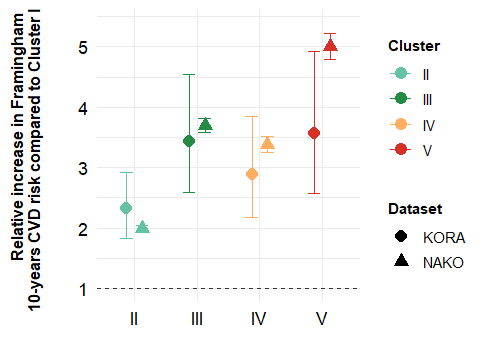
We analyzed cross-sectional data from 29,352 individuals (44.2% female; mean age 48±12 years; BMI 26.5±4.7 kg/m2) from the NAKO baseline examination (2014–2019), who underwent comprehensive health assessments, including interviews, questionnaires, biosample collection, and whole-body MRI. Body composition subphenotypes were replicated using a cluster validation framework. Associations with 10-year CVD risk, estimated by the Framingham score, were evaluated using linear regression.
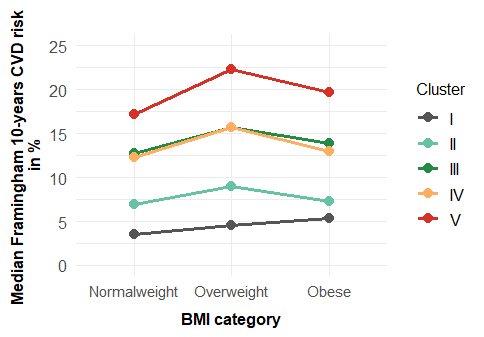
The five subphenotypes (I–V) were successfully replicated. Cluster I (“lean”) was youngest, had the lowest prevalence of hypertension, hypercholesterolemia, and diabetes, and the lowest CVD risk. This cluster was the reference category in further analyses. Cluster II (“average adiposity”) showed intermediate risk factor levels and a 2-fold higher CVD risk (95% CI 1.9–2.0). Cluster III (“bone and muscle adiposity”) included older participants (56±9 years) and showed a 3.7-fold higher risk (3.6–3.8), consistent with regular age-related changes. Cluster IV (“hepato-abdominal adiposity”) had a similar age (50±10 years) as cluster II (48±10 years) but adverse cardiometabolic features, elevated liver enzymes, and 3.4-fold higher risk (3.3–3.5). Cluster V (“general and pancreatic adiposity”) had the highest burden of comorbidities, and a 5-fold higher CVD risk (4.8–5.2). With an age (59±8 years) comparable to cluster III, it represents an unhealthy ageing pattern.
In conclusion, MRI robustly identifies distinct body composition subphenotypes that capture the interplay of AT depots, potentially reflect aging pathways, and show differential CVD risk. Our results highlight the potential of AT distribution for personalized risk assessment and ageing trajectories.
Grune, Elena
(
Medical Center - University of Freiburg
, Freiburg , Germany )
Haueise, Tobias
(
Helmholtz Munich at the University of Tuebingen
, Tuebingen , Germany )
Von Itter, Marc-nicolas
(
Medical Center - University of Freiburg
, Freiburg , Germany )